India from last several years achieving rapid economic growth and remarkable progress in certain economic variables such as infrastructure, education, health, foreign Trade, etc. If we look at the Asia continent then after China, India is in the position of global economic superpower due to its vast influence in trade, industry, IT and Space sector developments. However, India is facing persistent challenges of profound income and wealth inequality. This disparity manifests in stark contrasts between the affluent and the impoverished, posing significant questions about the efficacy of economic policies and their implications for social welfare.
In this article I will be discussing about the core components of India’s income and wealth inequality with Berguson and Samuelson Social Welfare Function and to gain a deeper understanding of these inequalities and their potential solutions, it is crucial to employ robust analytical frameworks. The Bergson-Samuelson Social Welfare Function (SWF) offers a valuable tool for such a comparative analysis.
For readers it is important to note that throughout this article I am not criticising any political party I am considering here only policy issues and how India can actually solve these issues with Berguson and Samuelson Social Welfare Function. For authenticity I will use certain data, graphs and charts for better understanding of these various policy issues.
Introduction Policy Orientation: India’s Income and Wealth Disparities —
India’s economic landscape reveals a troubling paradox. Despite significant economic gains, a substantial portion of the population continues to struggle with poverty and limited access to essential resources and opportunities. Income distribution data highlights the concentration of wealth within a small segment of the population, leading to concerns about economic justice and the long-term sustainability of India’s growth model.
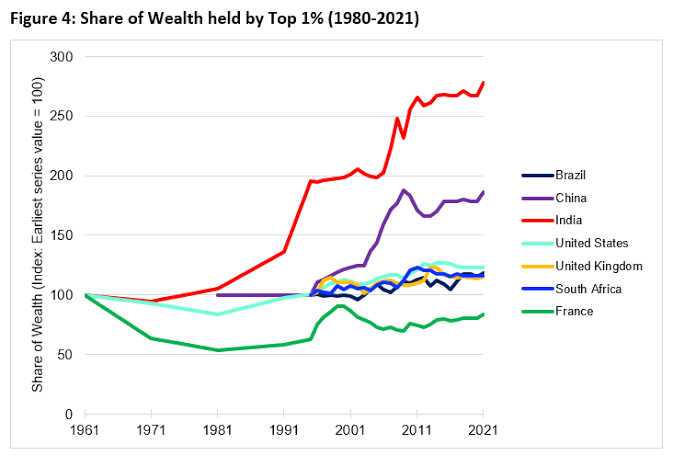
While India is one of the fastest growing economies in the world, it is also one of the most unequal countries.
Inequality has been rising sharply for the last three decades. The richest have cornered a huge part of the wealth created through crony capitalism and inheritance.
They are getting richer at a much faster pace while the poor are still struggling to earn a minimum wage and access quality education and healthcare services, which continue to suffer from chronic under-investment.
These widening gaps and rising inequalities affect women and children the most.
According to the Oxfam International Data, The top 10% of the Indian population holds 77% of the total national wealth. 73% of the wealth generated in 2017 went to the richest 1%, while *670 million Indians who comprise the poorest half of the population saw only a 1% increase in their wealth.
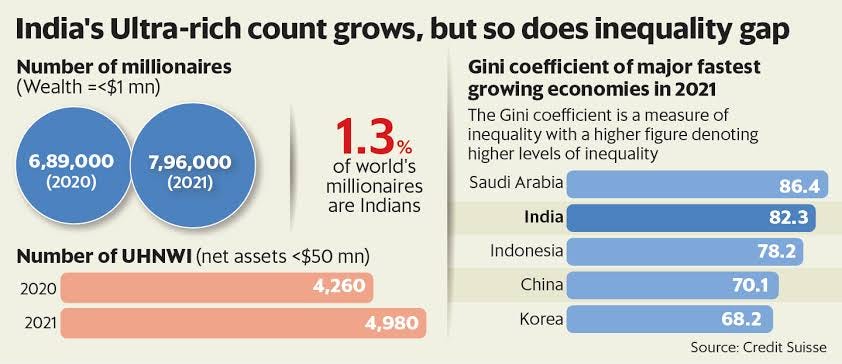
There are 119 billionaires in India. Their number has increased from only 9 in 2000 to 101 in 2017. Between 2018 and 2022, India is estimated to produce 70 new millionaires every day.
Billionaires’ fortunes increased by almost 10 times over a decade and their total wealth is higher than the entire Union budget of India for the fiscal year 2018-19, which was at INR 24422 billion.
Understanding the nature and extent of these inequalities is critical for addressing them effectively.
The Bergson-Samuelson Social Welfare Function: A Theoretical Framework —
The Bergson-Samuelson SWF provides a means to assess the overall well-being of a society. It aggregates the welfare or utility of individuals within a society, allowing for the evaluation of different social states based on income and wealth distribution. Importantly, this function moves beyond purely utilitarian approaches by incorporating value judgments about the desired level of equality within a society.
Relevance to the Indian Context —
The Bergson-Samuelson SWF offers particular relevance to the Indian case for several reasons:
- Emphasis on Distribution: The function allows for the explicit consideration of income and wealth distribution patterns, making it a suitable tool to analyze a key concern for policymakers in India.
- Accommodation of Diverse Preferences: Acknowledging that diverse individuals may hold different values regarding equality and fairness, the SWF allows for the integration of these preferences into the assessment.
- Potential Policy Insights: By applying the SWF, researchers can potentially identify policies that maximize social welfare while taking into account the trade-offs between growth and equitable distribution.
Now in order to understand the comparative analysis we need to outline this study which is as follows — This study aims to conduct a comparative analysis of India’s income and wealth inequality using the Bergson-Samuelson SWF as its foundation. The following key components will guide the research.
- Data and Metrics: The study will utilize relevant data on income and wealth distribution in India, employing appropriate metrics to quantify inequality (e.g., Gini coefficient, income share of top 1%).
- Construction of the SWF: The Bergson-Samuelson SWF will be carefully constructed, incorporating societal preferences on the relative importance of equality versus overall income levels.
- Comparative Analysis: Through the application of the SWF, different scenarios of income and wealth distribution, as well as various policy interventions, will be evaluated and compared in terms of their impact on overall social welfare in India.
By including the Bergson-Samuelson Social Welfare Function, this study endeavors to contribute to a deeper understanding of the complex dynamics of income and wealth inequality in India. The insights garnered from this research can inform policy discussions aimed at fostering greater economic equality and promoting a more inclusive and just society.
Theoretical Background: Core Concepts of the Bergson-Samuelson Social Welfare Function (BSWF) —
Defining the BSWF:
The BSWF, formulated by Abram Bergson in 1938 and further developed by Paul Samuelson, is a theoretical tool in welfare economics. It attempts to aggregate the individual utilities (satisfaction or well-being) of every member within a society into a single numerical value representing overall social welfare.
The BSWF operates under several key assumptions:
- Cardinally measurable individual utilities: The function assumes individuals can express their preferences quantitatively, assigning numerical values to their levels of satisfaction. This assumption has been a subject of critique, as measuring individual well-being in cardinal terms is often considered challenging, if not impossible.
- Ordinality: Similar to ordinal utility analysis, the BSWF relies on the ranking of individual utilities, not their specific numerical values. This avoids the challenging and often criticized assumption of interpersonally comparable cardinal utilities.
- Interpersonal comparability of utilities: The BSWF allows for comparison of individual utilities across different people. This implies the ability to compare and weigh the well-being of one individual against another, which raises ethical and philosophical concerns.
- Social preferences: The BSWF incorporates societal preferences regarding the desired level of equality in the distribution of individual utilities. This allows for the analysis of welfare not only based on the total sum of individual utilities but also on the fairness of their distribution.
BSWF and Income Distribution:
The BSWF offers a way to analyze how societal preferences concerning income distribution affect social welfare.
- Reflecting Inequality Preferences: The function can be constructed to incorporate different societal preferences towards equality. For instance, a function favoring greater equality would give more weight to improvements in the well-being of those at the lower end of the income spectrum.
- Illustrating Efficiency-Equity Trade-Offs: The BSWF allows for the exploration of the trade-offs between efficiency (maximizing total output) and equity (fairness in distribution). Policies promoting greater equality might sometimes come at the cost of lower overall economic output. By analyzing the BSWF under different income distribution scenarios, the function helps visualize this trade-off.
In essence, the BSWF, despite its limitations, remains a valuable tool for understanding the relationship between individual preferences, income distribution, and overall societal well-being. It allows researchers and policymakers to explore the implications of different policies and societal preferences on the collective well-being of a nation. However, its application requires careful consideration of its assumptions and limitations, particularly the challenges of measuring and comparing individual utilities.
India’s Income and Wealth Inequality: An Overview —
India, despite experiencing significant economic growth in recent decades, faces a persistent challenge: deep income and wealth inequality. This section provides a detailed picture of this inequality using key metrics:
1. Gini Coefficient:
The Gini coefficient measures income inequality on a scale of 0 (perfect equality) to 1 (perfect inequality).
Current Situation: According to the World Bank, India’s Gini coefficient for income inequality stood at 0.35 in 2020. Although it shows a slight decline from previous years, indicating a trend towards slightly more equality, the gap remains significant.
Visualization: A line graph can be created to show the trend of the Gini coefficient over time, allowing for a visual representation of the historical and current state of income inequality.
2. Income Shares of Top Percentiles:
Examining income shares held by different segments of the population provides another perspective on inequality.
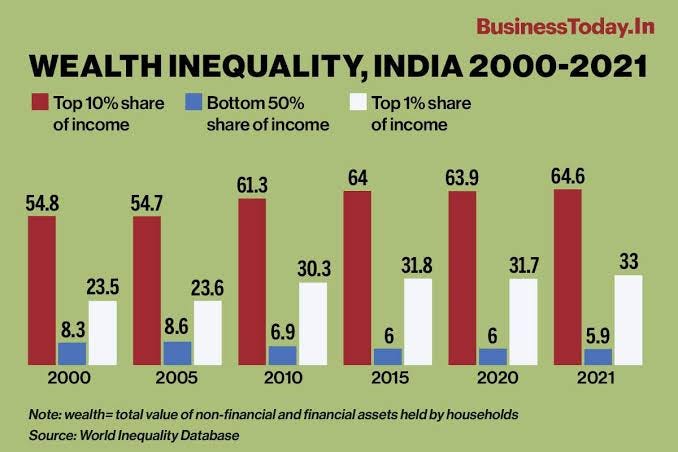
Top 1%: Data from the World Inequality Lab indicates that the top 1% of earners in India capture approximately 21.6% of the total national income (2020). This means a small group enjoys a significantly larger share of the income pie.
Top 10%: Expanding the scope, the top 10% of earners control close to 53.8% of the national income, further highlighting the concentration of wealth at the top.
Visualization: To visually represent this, a bar chart can be created, showing the percentage share of income held by different income groups (e.g., top 1%, top 10%, bottom 50%).
3. Wealth Concentration Ratios:
While income inequality paints part of the picture, wealth inequality is another important aspect. Wealth encompasses assets like property, financial holdings, and inheritances.
Limited Data: Reliable data on wealth distribution in India is scarce due to various methodological and reporting challenges. However, estimates from Forbes and other sources suggest that the richest 1% own a significant portion of the nation’s wealth, potentially exceeding 35%.
Overall, the data presented reveals a concerning picture of income and wealth inequality in India. While there might be slight improvements in income inequality, the concentration of wealth at the top of the income spectrum remains significant. These statistics highlight the need for further research and policy discussions aimed at addressing this complex challenge and promoting a more equitable distribution of resources.
It is crucial to acknowledge the limitations of these measures. Gini coefficient, for instance, doesn’t capture the full picture of inequality across different income groups. Additionally, wealth data is often estimated and may not be fully comprehensive. Despite these limitations, these metrics offer valuable insights into the current state of inequality in India.
Drivers of Inequality in India: A Closer Look —
India, despite impressive economic growth in recent decades, grapples with a significant issue: socioeconomic inequality. This disparity manifests in various forms, affecting individuals, communities, and regions. Let’s delve deeper into the key factors contributing to this complex issue:
1. Structural Inequalities in the Labor Market:
- Formal vs Informal Sector: A prominent feature of the Indian economy is the vast informal sector, which employs a large portion of the workforce, particularly in rural areas. This sector often lacks job security, minimum wages, and social security benefits, perpetuating economic vulnerability.
- Skill Mismatch: The education system might not adequately equip graduates with the skills demanded by the evolving job market. This skills gap hinders upward mobility and widens the income gap between skilled and unskilled workers.
- Discrimination based on Caste and Gender: Discrimination based on caste and gender permeates the labor market, limiting opportunities for marginalized groups. This manifests in wage gaps, exclusion from certain professions, and restricted access to promotions.
2. Unequal Access to Education and Healthcare:
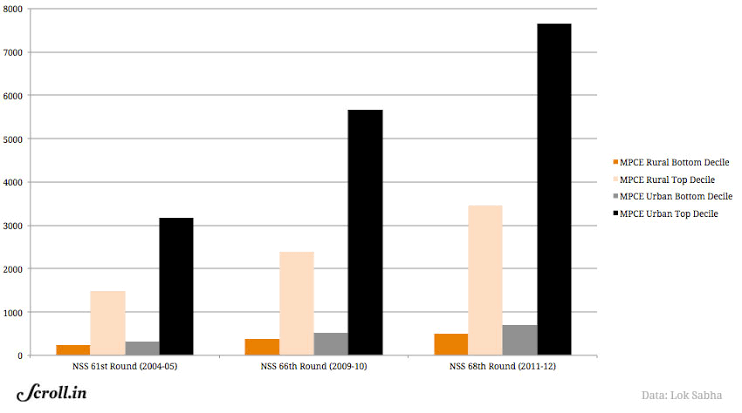
- Limited Access in Rural Areas: Access to quality education and healthcare remains a challenge, particularly in rural regions. This creates a cycle of disadvantage where children from disadvantaged backgrounds struggle to gain necessary skills for better-paying jobs and lack access to proper healthcare, impacting overall well-being and future prospects.
- Privatization and Cost Barriers: While private institutions offer alternatives, they often come with high costs, excluding low-income groups from accessing quality education and advanced healthcare, further exacerbating pre-existing inequalities.
- Gender Disparity: Girls from disadvantaged backgrounds often face higher barriers to education due to cultural norms and social pressures, limiting their opportunities for social and economic mobility.
3. Regional Disparities:
- Development Imbalances: Significant disparities exist in economic development across different regions in India. Developed states attract greater investment, infrastructure, and job opportunities, while others lag behind, leading to uneven economic growth and unequal distribution of resources.
- Geographical Challenges: Remote regions often face challenges like lack of infrastructure, limited access to markets, and vulnerability to natural disasters, hindering economic development and perpetuating poverty.
4. Policy Biases:
- Tax System: The current tax system in India primarily relies on indirect taxes (like GST) that disproportionately burden low-income groups compared to direct taxes on income and wealth. This can further exacerbate income inequality.
- Subsidies: While subsidies are intended to assist the underprivileged, their design and implementation can sometimes be ineffective, missing their intended beneficiaries or creating distortions in the market.
Addressing Inequality: A Collective Responsibility
Combating inequality requires a multi-pronged approach. Policymakers need to address structural inequalities, improve access to quality education and healthcare, bridge regional disparities, and ensure a fair and progressive tax system. Additionally, promoting social inclusion, empowering women, and fostering an environment of equal opportunity are crucial in building a more equitable society.
This analysis highlights the complex nature of inequality in India. Recognizing the various factors at play and implementing comprehensive solutions will be critical in ensuring inclusive and sustainable development for all.
Consequences of Inequality:
Severe income and wealth inequality in India carries far-reaching consequences, hindering the nation’s development and impacting social harmony. Here’s an in-depth look at these impacts:
Economic Consequences —
- Hindered Economic Growth: High levels of inequality limit the full potential of the economy. A vast population living with economic vulnerability has reduced purchasing power, which constrains overall demand and market growth.
- Inefficient Resource Allocation: Wealth concentration in the hands of a few distorts resource distribution, potentially diverting investment from sectors essential for broad-based economic growth and social progress.
- Weakened Human Capital: Limited access to education, healthcare, and opportunities for the poor and marginalized prevents them from developing their skills and fulfilling their potential. This hinders the development of a skilled and healthy workforce essential for sustained economic progress.
- Reduced Tax Revenue: Extreme income and wealth inequality can lead to tax evasion and a narrowing of the tax base. This limits the government’s resources for investing in essential infrastructure, social services, and programs that could promote greater equality.
Social Consequences —
- Social Unrest and Conflict: Wide disparities in wealth and opportunity breed a sense of injustice and resentment, creating social tensions that can spill over into protests, unrest, and even violence.
- Erosion of Social Cohesion: Inequality undermines trust and solidarity in a society, promoting a sense of division and a lack of common purpose, hindering collective action towards addressing wider social problems.
- Crime and Public Safety: Research suggests a potential link between high inequality and crime rates. Economic desperation can drive individuals towards crime, affecting public safety and destabilizing communities.
- Weakened Democracy: Concentrated wealth can often translate into political influence, disproportionately shaping policies in favor of the wealthy elite at the expense of addressing broader social needs.
Broader Implications for India’s Development — - Poverty Persistence: Severe inequality traps people in cycles of poverty, limiting their ability to escape deprivation and contributing to intergenerational poverty.
- Compromised Sustainability: Inequality undermines efforts to achieve sustainable development goals. When large segments of the population lack basic resources and opportunities, it’s difficult to effectively address environmental concerns and build a genuinely sustainable future.
Addressing the severe consequences of inequality is vital to ensuring sustained and equitable development in India. This requires a comprehensive approach focused on: - Progressive Taxation: Reformulating tax systems to ensure greater equity and resource generation for essential social services.
- Inclusive Labor Market Policies: Promoting formal sector jobs, implementing minimum wage guarantees, and combating discrimination to ensure fair working conditions and improved living standards.
- Investing in Education and Healthcare: Expanding access to quality education and healthcare, especially in underserved communities, is crucial for breaking poverty cycles and building human capital.
- Addressing Regional Disparities: Prioritizing infrastructure development and targeted investments in underdeveloped regions to promote balanced economic growth.
Severe inequality is not inevitable. By recognizing its devastating impacts and implementing policies focused on fairness, inclusion, and opportunity, India has the potential to build a more equitable society and unlock its true development potential.
The BSWF Perspective on India’s Inequality — The Bergson-Samuelson Social Welfare Function (BSWF) provides a theoretical framework for evaluating the social welfare of a society based on the individual utilities (or well-being) of its members. While the BSWF has limitations in real-world applications, it offers a valuable lens to analyze and visualize how income and wealth inequality in India can impact its overall social well-being.
Hypothetical Social Welfare
Contour Map:
Imagine a two-dimensional graph where:
X-axis: Represents the average income of the poorest individuals in the society (low on the left, high on the right).
Y-axis: Represents the average income of the wealthiest individuals in the society (low on the bottom, high on the top).
Lines on this graph represent social indifference curves, which connect points with the same level of social welfare. Higher curves represent higher levels of social well-being. The specific shape and curvature of these lines depend on the underlying social welfare function, which incorporates societal values and priorities regarding income distribution.
Mapping India’s Inequality:
Unequal Distribution: Due to India’s significant income and wealth disparities, a point representing India’s current distribution would likely fall far below the highest achievable social welfare level.
Steep Gradient: The social welfare contour map would likely show a steep gradient in the area representing India’s current distribution, indicating that small improvements in the average income of the poorest can significantly enhance overall social welfare.
Flattening Curve: As income inequality declines and the distribution becomes more even (average incomes on both axes converge), the social welfare contour map would show a flattening curve, signifying diminishing marginal gains in social welfare from further narrowing the income gap.
Interpreting the Map:
Unequal societies like India would be positioned closer to the bottom left corner of the map, indicating low social welfare due to the vast gap between the rich and poor.
More equitable societies would be positioned closer to the top right corner, reflecting a higher level of social welfare due to a more balanced distribution of income and resources.
Limitations:
The BSWF is a theoretical framework and doesn’t account for all factors influencing social welfare.
Assigning specific values to individual utilities and constructing a precise social welfare function is complex and subjective, depending on societal values and priorities.
The visualization is simplified and doesn’t capture the nuances of real-world income distributions.
Exploring India’s inequality through the BSWF framework allows us to visualize the potential impact of improving income distribution on overall social well-being. While the BSWF has limitations, it provides a thought experiment to highlight the potential benefits of addressing inequality in India and fostering a more equitable society.
Conclusion — The analysis of India’s income and wealth inequality through the Bergson-Samuelson Social Welfare Function underscores the severity of the problem and its complex underpinnings. The BSWF illuminates the trade-offs between efficiency and equity inherent in policy choices. While India has made strides in economic growth, its current levels of inequality are incompatible with maximizing societal well-being as conceptualized within the BSWF. A comparative analysis further highlights that alternative policy approaches can lead to more equitable and socially desirable outcomes.
Thanks.

Leave a comment