Yield Curves : A key for Economic Forecasters
Yield curves, a graphical representation of the interest rates for bonds with different maturities, have long been a cornerstone of economic analysis. These curves offer a unique perspective on market expectations, investor sentiment, and the overall economic outlook. By understanding the shape and dynamics of yield curves, economists, policymakers, and investors can gain invaluable insights into the future direction of the economy.
This article will delve into the intricacies of yield curves, exploring their various shapes, the factors that influence their formation, and their significance in economic forecasting. We will examine how yield curves can serve as a leading indicator of economic recessions, inflation trends, and monetary policy decisions. Additionally, we will discuss the challenges and limitations associated with interpreting yield curves and explore potential alternative indicators.
By the end of this article, readers will have a comprehensive understanding of yield curves and their role in economic analysis. This knowledge will equip them to make informed decisions and navigate the complex landscape of economic forecasting.
Understanding Yield Curves —
Definition and Components — A yield curve is a graphical representation of the relationship between the interest rates of bonds with different maturities. It shows how the interest rate on a bond changes as its time to maturity increases.
There are three main types of yield curves:
- Normal Yield Curve: This is the most common type, where the interest rates on longer-term bonds are higher than those on shorter-term bonds. This suggests that investors expect to receive higher returns for taking on the increased risk associated with longer-term investments.
- Inverted Yield Curve: This occurs when the interest rates on shorter-term bonds are higher than those on longer-term bonds. This is often seen as a sign of an impending recession, as it suggests that investors are expecting economic conditions to worsen in the future, leading them to demand higher returns for holding longer-term bonds.
- Flat Yield Curve: This occurs when the interest rates on bonds of all maturities are roughly equal. This indicates a lack of confidence in the economy, as investors are unsure about future economic conditions and are unwilling to accept higher interest rates for longer-term bonds.
Factors Influencing Yield Curves —
Several factors can influence the shape of a yield curve, including:
- Interest Rates: Changes in interest rates set by the central bank can significantly impact yield curves. If the central bank raises interest rates, the yield curve tends to steepen, as investors demand higher returns for holding longer-term bonds. Conversely, if the central bank lowers interest rates, the yield curve tends to flatten or invert.
- Inflation Expectations: If investors expect inflation to rise in the future, they will demand higher interest rates on longer-term bonds to compensate for the erosion of purchasing power. This can lead to a steeper yield curve. Conversely, if investors expect inflation to remain low or decline, the yield curve may flatten or invert.
- Economic Growth: If the economy is expected to grow strongly in the future, investors will be more willing to invest in longer-term bonds, which can lead to a steeper yield curve. However, if economic growth is expected to slow or contract, investors may be more cautious and demand higher returns for holding longer-term bonds, potentially leading to a flatter or inverted yield curve.
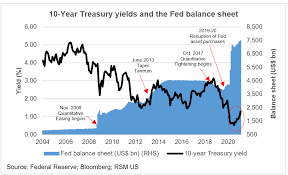
- Monetary Policy: The central bank’s monetary policy decisions can significantly impact yield curves. For example, if the central bank engages in quantitative easing (buying government bonds), this can increase the demand for bonds and lower interest rates, leading to a flatter yield curve. Conversely, if the central bank tightens monetary policy by selling bonds, this can reduce the demand for bonds and raise interest rates, leading to a steeper yield curve.
Understanding yield curves is essential for investors, as they can provide valuable insights into the economic outlook and potential investment opportunities. By analyzing the shape of the yield curve and the factors influencing it, investors can make informed decisions about their investment portfolios.
Yield Curves as Economic Indicators — Yield curves have long been recognized as powerful economic indicators, providing valuable insights into the health of an economy. One of their most notable uses is as a leading indicator of recessions.
Leading Indicator of Recessions
Inverted Yield Curves and Economic Downturns — Historically, inverted yield curves, where short-term interest rates are higher than long-term interest rates, have often been seen as a reliable predictor of economic downturns. This phenomenon can be explained by several factors:
- Market Expectations: An inverted yield curve suggests that investors anticipate future economic conditions to worsen. They may be less willing to invest in long-term bonds, demanding higher returns to compensate for the perceived risk. This leads to lower yields on longer-term bonds compared to shorter-term ones.
- Credit Market Stress: Inverted yield curves can also indicate stress in the credit market. As economic conditions deteriorate, lenders become more cautious, making it more difficult for businesses and individuals to obtain loans. This can lead to a decline in economic activity and a potential recession.
- Central Bank Policy: Inverted yield curves can sometimes be a result of central bank policies aimed at slowing down the economy to prevent inflation. By raising short-term interest rates, the central bank can make it more expensive for businesses and consumers to borrow, which can lead to a slowdown in economic activity.
While inverted yield curves are a strong indicator of potential recessions, they are not infallible. There have been instances where an inverted yield curve has not been followed by a recession. It’s important to consider other economic indicators in conjunction with yield curves to get a more complete picture of the economic outlook.
Inflation Expectations
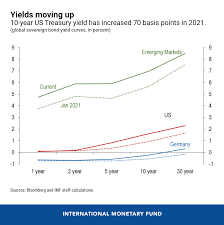
Yield Curves and Future Inflation — Yield curves can also provide insights into market expectations for future inflation rates. If investors expect inflation to rise in the future, they will demand higher interest rates on longer-term bonds to compensate for the erosion of purchasing power. This can lead to a steeper yield curve, where the yield on longer-term bonds is significantly higher than the yield on shorter-term bonds.
Conversely, if investors expect inflation to remain low or decline, they may be more willing to accept lower interest rates on longer-term bonds. This can lead to a flatter or even inverted yield curve.
By analyzing the shape of the yield curve, investors and policymakers can gauge market sentiment regarding inflation and adjust their strategies accordingly.
Monetary Policy Effectiveness —
Yield Curves and Central Bank Policies — Yield curves can also provide valuable information about the effectiveness of central bank policies. For example, if a central bank lowers interest rates to stimulate the economy, but the yield curve remains flat or inverted, it may suggest that the market is not convinced that the policy will be effective. This could indicate that other factors, such as credit market conditions or consumer confidence, are limiting the impact of the central bank’s actions.
On the other hand, if a central bank raises interest rates to curb inflation, and the yield curve steepens significantly, it suggests that the market is expecting the policy to be effective in slowing down the economy. This can provide policymakers with confidence that their actions are having the desired effects.
Yield curves are a valuable tool for understanding economic conditions and forecasting future trends. By analyzing the shape of the yield curve and considering the factors that influence it, investors and policymakers can make informed decisions about their strategies.
Interpreting Yield Curves —
Yield curves, as a graphical representation of the relationship between interest rates and time to maturity, offer valuable insights into the economic landscape. By analyzing the shape, slope, and term spread of a yield curve, investors and policymakers can gain valuable information about the current economic conditions and potential future trends.
Shape Analysis —
The shape of a yield curve can provide clues about the prevailing economic conditions and market expectations:
- Normal Yield Curve: A normal yield curve, where interest rates on longer-term bonds are higher than those on shorter-term bonds, is generally seen as a sign of a healthy economy. This suggests that investors are willing to accept higher yields for holding longer-term bonds, indicating confidence in future economic growth and lower perceived risk.
- Inverted Yield Curve: An inverted yield curve, where short-term interest rates are higher than long-term interest rates, is often interpreted as a leading indicator of an impending recession. This suggests that investors are anticipating economic conditions to worsen in the future, leading them to demand higher returns for holding shorter-term bonds.
- Flat Yield Curve: A flat yield curve, where interest rates on bonds of all maturities are roughly equal, can be seen as a sign of economic uncertainty. It suggests that investors are unsure about future economic conditions and are unwilling to accept higher interest rates for longer-term bonds.
Slope Analysis —
The slope of a yield curve, which measures the difference between the yields on long-term and short-term bonds, can also provide valuable information about economic conditions:
- Steep Yield Curve: A steep yield curve, where the difference between long-term and short-term yields is significant, suggests that investors expect economic growth and inflation to rise in the future. This can lead to higher interest rates on longer-term bonds to compensate for the perceived risk.
- Flat Yield Curve: A flat yield curve, where the difference between long-term and short-term yields is small, indicates a lack of confidence in future economic growth and inflation. Investors may be hesitant to invest in longer-term bonds, leading to lower yields.
- Inverted Yield Curve: An inverted yield curve, where short-term interest rates are higher than long-term interest rates, is often seen as a sign of an impending recession, as discussed earlier.
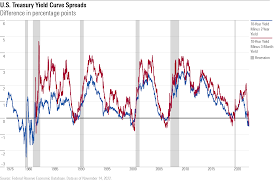
Term Spread
The term spread is the difference between the yield on a long-term bond and the yield on a short-term bond. It can provide insights into the market’s expectations for future interest rates and economic conditions:
- Positive Term Spread: A positive term spread, where the yield on a long-term bond is higher than the yield on a short-term bond, suggests that investors expect interest rates to remain stable or rise in the future. This can be interpreted as a sign of economic confidence and a willingness to invest in longer-term bonds.
- Negative Term Spread: A negative term spread, where the yield on a short-term bond is higher than the yield on a long-term bond, indicates that investors expect interest rates to decline in the future. This can be a sign of economic uncertainty or a potential recession.
By analyzing the shape, slope, and term spread of a yield curve, investors and policymakers can gain valuable insights into the current economic conditions and potential future trends. These insights can be used to make informed decisions about investments, monetary policy, and other economic policies.
Challenges and Limitations of Yield Curves — While yield curves provide valuable insights into economic conditions, they are not without their limitations. Understanding these challenges is essential for accurately interpreting and using yield curves as an economic indicator.
Market Noise and Short-Term Fluctuations —
Yield curves can be influenced by various factors, including market noise and short-term fluctuations. These factors can obscure long-term trends and make it difficult to accurately assess the underlying economic conditions. For example, temporary shifts in investor sentiment or unexpected events can cause short-term spikes or dips in interest rates, leading to temporary changes in the shape of the yield curve.
To overcome this challenge, it is important to consider the broader context and analyze yield curves over a longer time period. By examining historical trends and comparing them to current conditions, investors and policymakers can better discern underlying economic signals from short-term noise.
Structural Changes in the Economy —
The relationship between yield curves and economic indicators can be affected by structural changes in the economy. For example, globalization and technological advancements have altered the way businesses operate and consumers spend. These changes can impact the correlation between interest rates and economic activity.
It is essential to recognize that traditional relationships between yield curves and economic indicators may not hold as firmly in a rapidly evolving economic landscape. Therefore, it is important to continually assess the relevance of yield curves as an indicator and consider alternative approaches.
Alternative Indicators —
While yield curves are a valuable tool for economic forecasting, they are not the only indicator available. It is often beneficial to consider alternative indicators to complement yield curves and provide a more comprehensive understanding of economic conditions. Some potential alternative indicators include:
- Leading Economic Indicators: These indicators, such as building permits, manufacturing orders, and stock market indices, often provide early signals of economic growth or contraction.
- Consumer Confidence Indices: These indices measure consumer sentiment and can provide insights into future spending patterns.
- Inflation Expectations: Measures of inflation expectations, such as surveys of economists or financial market participants, can help gauge the potential for future price increases.
- Economic Growth Forecasts: Forecasts from economic research firms and government agencies can provide additional context and perspective on the economic outlook.
By combining yield curve analysis with alternative indicators, investors and policymakers can obtain a more robust and accurate assessment of economic conditions and make informed decisions.
Case Studies of Yield Curves —
Yield curves have a long history of accurately predicting economic recessions and other significant events. Here are a few notable examples:
- The Great Recession (2007–2009): In the years leading up to the Great Recession, the yield curve began to flatten and eventually inverted, signaling the potential for an economic downturn. This inversion was a key warning sign that helped economists and policymakers anticipate the severity of the crisis.
- The Dot-com Bubble (1990s): Prior to the collapse of the dot-com bubble, the yield curve flattened, suggesting that investors were becoming more cautious about the future. This flattening helped to identify potential vulnerabilities in the market and contributed to the subsequent correction.
- The 1990–1991 Recession: In the late 1980s, the yield curve inverted, signaling a potential recession. This inversion was followed by a mild recession in 1990–1991, demonstrating the accuracy of yield curves as a leading indicator.
Recent Trends —
Yield curve dynamics have continued to be a significant topic of discussion in recent years. Here are some current trends and their potential implications:
- Flattening Yield Curves: In recent years, there have been periods of flattening yield curves, raising concerns about the possibility of an economic downturn. However, the relationship between yield curves and economic recessions has become more complex in recent years, influenced by factors such as central bank policies, global economic conditions, and technological advancements.
- The Impact of Central Bank Policies: Central banks have played a significant role in shaping yield curves in recent years. For example, quantitative easing programs have led to a flattening of yield curves as central banks purchase large quantities of government bonds.
- Global Economic Uncertainty: Increased global economic uncertainty, such as trade tensions and geopolitical risks, can also impact yield curves. Investors may become more cautious, leading to a flattening or inversion of the yield curve.
It is important to note that while yield curves can be a valuable tool for economic forecasting, they are not infallible. Factors such as market noise, structural changes in the economy, and the evolving role of central banks can influence the relationship between yield curves and economic indicators.
Conclusion — Yield curves, as a graphical representation of the relationship between interest rates and time to maturity, have long served as a valuable tool for economic forecasters. By analyzing the shape, slope, and term spread of yield curves, investors and policymakers can gain valuable insights into the current economic conditions and potential future trends.
While yield curves have proven to be a reliable indicator of economic recessions and other significant events, it is essential to recognize their limitations. Factors such as market noise, structural changes in the economy, and the evolving role of central banks can influence the relationship between yield curves and economic indicators.
To accurately interpret and use yield curves as an economic forecasting tool, it is crucial to consider the broader context, analyze historical trends, and combine yield curve analysis with other economic indicators. By doing so, investors and policymakers can make informed decisions about their strategies and contribute to a more stable and prosperous economy.
Thanks.

Leave a comment